Lab 3.6 - Release to production and read your DORA metrics
Level: 3 Release Manager
Time: ~35 min
You will: release to production, and then measure whether your pipeline is any good.
The situation
UAT signed off. The release goes to production this evening.
This is the same mechanism as Lab 3.5, twice: uat into preprod, then preprod into main. With one
difference that is not technical: if you get it wrong, real people cannot do their jobs tomorrow.
Everything in this lab that looks like ceremony is there because somebody skipped it once.
Before you start
- Lab 3.5 finished:
uatcarries the release and the testers signed it off -
helios-preprodandhelios-prodconnected, seeded, and configured as thepreprodandmainorgs in Lab 3.1 - JWT authentication working for
preprodandmain
Steps
1. Check the three things that are worth checking
Before creating anything:
One: is UAT genuinely signed off? Not "the deployment was green". Somebody tested it and said yes. On this project that person is you, and you did it in Lab 3.5 step 6.
Two: what manual steps will this carry? Look at the deployment actions of the stories going out. A manual step in production is something you will do, live, in front of nobody, at whatever time the release is. Know about it now.
Three: is production where you think it is? Open helios-prod and look. It should carry what
the course seeded into it and nothing else yet. On a real project, admins change production by hand
between two releases, and Lab 3.7 is about exactly that. Assume nothing.
2. Rehearse in preprod
The same way you created the promotion in Lab 3.5: the + PR chip on the arrow from uat to
preprod, in the DevOps Pipeline diagram. GitHub opens on the Pull Request from uat into
preprod.
Its check job is the first one to log into helios-preprod, and it does so with the key and the
secrets of Lab 3.1: a green check here is your preprod JWT set-up working.
Title it plainly:
Promotion 2026-09 to preprod
Read the check, merge, and watch the Process Deployment (sfdx-hardis) run on preprod. Then
open helios-preprod and do the checks of step 6 there first.
This is what preprod is for. It holds what production holds, nobody works in it, and a release
that deploys there cleanly and behaves has very little left to surprise you with in production. A
release that fails here has cost you nothing.
3. Create the production Pull Request
The + PR chip on the arrow from preprod to main, from preprod into main. Its check job is
the first JWT login into helios-prod. Title it plainly:
Release 2026-09 to production
4. Read the check like it matters
When the check finishes, read the sfdx-hardis comment the way Lab 3.2 taught, and add two questions that only apply to production:
| Question | Where to look |
|---|---|
| Does it delete anything? | The deleted figure in the counts line. A deletion in production is permanent and takes data with it |
| How long will it take? | The check duration is a reasonable estimate. If it is 40 minutes, that is 40 minutes during which the org is being modified |
If that figure is not zero and you were not expecting it, stop. The comment will not tell you
what is going: manifest/destructiveChanges.xml and the diff will. Find out what it is and who
intended it. That is not being careful, that is the job.
5. Merge, and stay
Merge. The Process Deployment (sfdx-hardis) run starts, this time on main.
Watch it. Not because you can do anything while it runs, but because knowing whether it failed at minute two or minute thirty-five changes what you do next.
When it finishes, do any manual steps, then check the org.
6. Verify in production
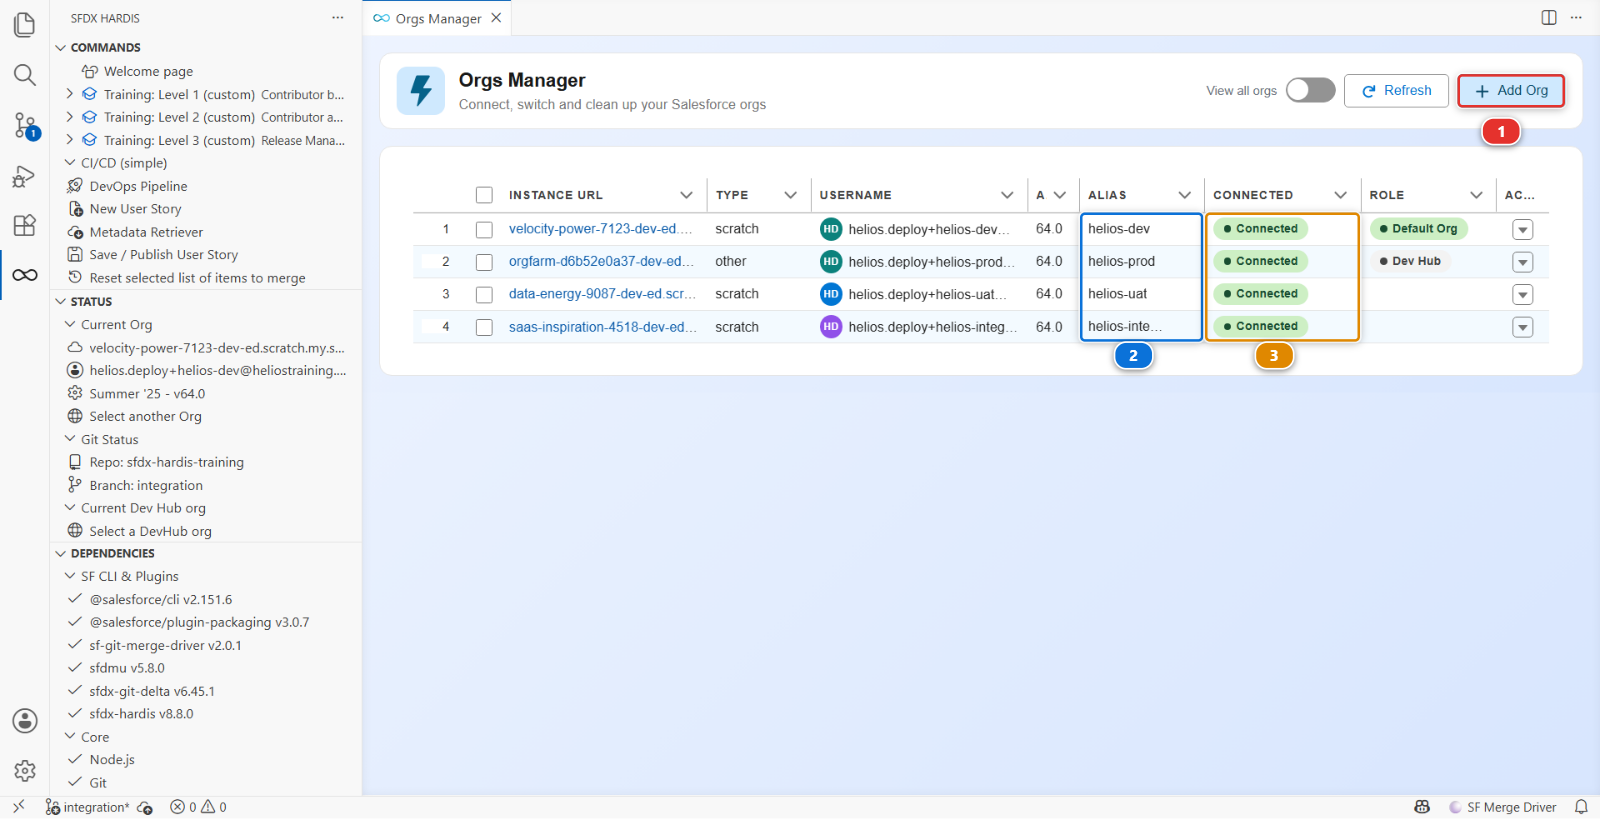
Open helios-prod from Orgs Manager: find it by its alias (2), check it says Connected
(3), then Open from the actions menu at the end of its row. A disconnected row offers
Reconnect in that same menu; Add Org (1) is for an org the table does not have.
Then check, the same as UAT and with more care:
- The two stories work
- Something that was already working still works: open an installation, check the timeline component, save a record
That last check exists because the most common production incident after a release is not the new feature failing. It is an old one.
7. Now measure the pipeline
You have shipped. The question a release manager gets asked next is "how are we doing", and it deserves a better answer than a feeling.
Point yourself at helios-prod first. Open Orgs Manager, find the helios-prod row, and
choose Set as Default Org in its actions menu. The report measures whatever org you are pointed
at: run it while helios-dev is your current org and you get a report about your sandbox, correctly
formatted and completely irrelevant.
Then open the DevOps Pipeline panel, click the gear (1) at the top right, and choose Generate DORA Metrics Report. The menu holds three entries and you have used the other two: Pipeline Settings in Lab 3.1, Add/Configure Org in Lab 3.1.
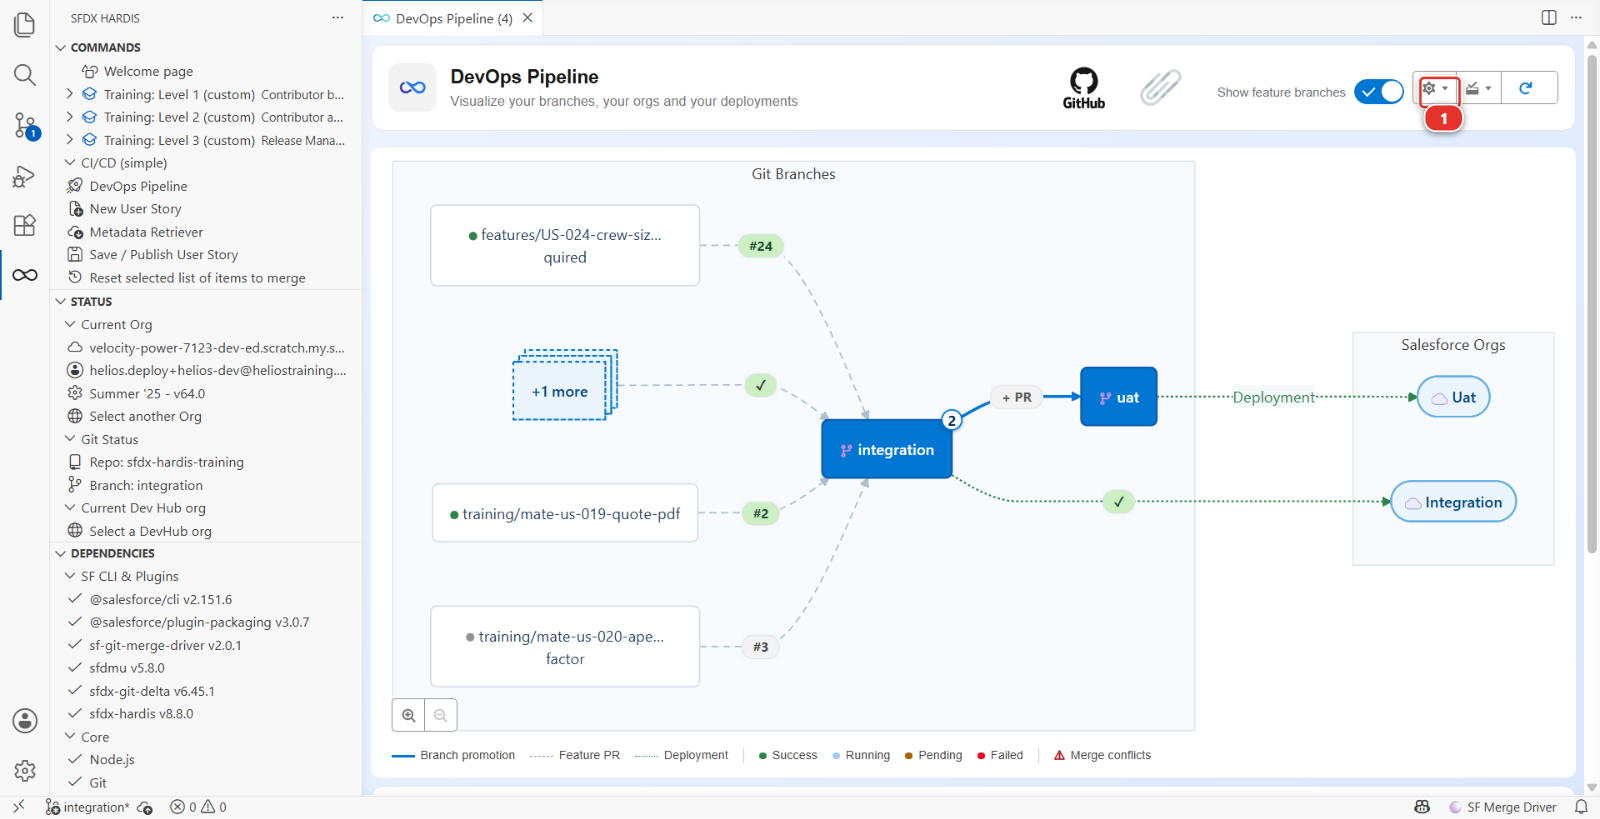
It covers the last 90 days by default, and it reports five numbers, not four:
| Metric | What it actually counts | What good looks like |
|---|---|---|
| Deployment Frequency | Successful deployments recorded in the org, divided by the period | Weekly is fine. Quarterly means every release is enormous |
| Lead Time for Changes | Per Pull Request: its creation, to the deployment that landed within 14 days | Days, not weeks. A long lead time means work is sitting somewhere |
| Change Failure Rate | Failed deployments divided by all deployments | Below 15%. Above that, the check is not catching what it should |
| Mean Time to Recovery | Median hours, despite the name, from a failed deployment to the next success | Hours |
| Deployment Rework Rate | Hotfix Pull Requests, and deployments that follow a failure within a day | Low. Read the note below before you expect Lab 3.7 to move it |
Two of those are not what the names suggest, and it is worth knowing which. Change failure rate here is a deployment failure rate: a release that deployed green and broke production on Tuesday does not appear in it. Mean Time to Recovery is the gap between a broken deployment and a working one, not between an incident and its fix. They measure your pipeline, not your org.
8. Read what is there, and know what is missing
You have shipped once. On a fresh production org, that is roughly what the report will show: a
handful of deployments over a 90 day window that was empty until this week, the ones Set up one of
my training orgs made to seed helios-prod and your release. There is no curve to read yet, and a
report that says so is telling the truth.
That is the honest version of this step, and it is also the point. A DORA report on a pipeline that has run once is an empty baseline. It becomes useful at the fourth or fifth release, when the numbers have somewhere to move from. Take the baseline now.
The report is a file, docs/dora/dora-report-<date>.md, and the panel opens it for you. Keep it
where it is: it is rebuilt from the org and the Pull Requests whenever you run the report again, so
nothing is committed, and Lab 3.10 compares the next one with this one.
Under the hood: where the DORA numbers come from
The command was:
sf hardis:doc:dora-report
and it reads two sources, which is the thing to know about it:
- Salesforce, through the Tooling API: every
DeployRequeston the target org in the period, with its status and its dates, ignoring validation-only runs. Deployment frequency, change failure rate and time to restore are computed from that and from nothing else - The git provider, for the merged Pull Requests into the current branch. Lead time pairs each
one with the first successful deployment that completed within 14 days of its merge. The rework
rate uses the branch names, recognising a fix by a
hotfix/,fix/orbugfix/prefix, and it takes the larger of that count and the deployments that followed a failed one within 24 hours
So it does not read productionBranch, it does not read developmentBranch, and it has no idea
which of your orgs is production. The org you point it at is the scope. Point it at a sandbox
and it will measure the sandbox, cheerfully.
One thing to check on any project. The rework rate recognises a corrective change by its
branch name, and it looks for hotfix/, fix/ or bugfix/. This project names its fix branches
fix/, so the hotfix you ship in Lab 3.7 counts. Rename that prefix to something else and the
metric quietly reads zero, with no warning. A number built on branch names is only as good as the
naming convention, which is worth checking before quoting one at anybody.
Two degradations worth recognising rather than debugging:
- No target org: the three Salesforce metrics read "No data available" and the report still prints
- No git provider token: it falls back to reading
git log, recognising the merge commits of GitHub and GitLab and the squash commits of GitHub and Azure DevOps. Lead time then reads zero: a commit carries the day it was merged, and not the day its Pull Request was opened
The report lands in hardis-report/ and is copied to docs/dora/.
The numbers are honest in a way a dashboard somebody fills in by hand never is. Nobody can improve deployment frequency by editing a spreadsheet. They are also narrower than the DORA names suggest, and a release manager quoting them should know which part they cover.
What you should see
preprodandmaincarrying the release- A green Process Deployment (sfdx-hardis) run on
preprod, then one onmain - The stories working in
helios-prod - A DORA report measured against
helios-prod, indocs/dora/
If it goes wrong
The deployment to production fails on a component that worked in preprod. Production has drifted, or has something preprod does not: an extra validation rule, a record type, real data that violates a new constraint. Read the error. This is the single most common production deployment failure, and it is the argument for keeping preprod as close to production as you can.
The deployment half-succeeded. Salesforce deployments are atomic per deployment, so this usually means a post-deploy action failed after a successful deployment. The metadata is in, the action is not. Re-run the action, do not re-run the deployment.
The DORA report says "No data available" for three of the metrics.
It had no target org. In Orgs Manager, set helios-prod as your default org, then open
Generate DORA Metrics Report again.
The report is about the wrong org.
Same cause, other direction: it measured your default org, which was not helios-prod.
Lead time is zero or missing.
No Pull Request data: there is no git provider token in the environment, and the git log
fallback cannot tell when a Pull Request was opened.
Check your work
Welcome page > Training: Level 3 > Check my work, then pick Lab 3.6.
Go deeper
Next: Lab 3.7 - Production is broken: hotfix and retrofit